Project DESTINI - Screen Size vs. Interface vs. Single or Double Data Entry

eHealth Africa (eHA), in partnership with Biostat Global Consulting, conducted a two-day research experiment in September of 2016 at eHA’s headquarters in Kano, Nigeria. The objective of the experiment was to estimate data entry error rates for dates on touchscreen devices (smartphones + tablets) and identify a combination of factors that yield very low error rates (<1%).
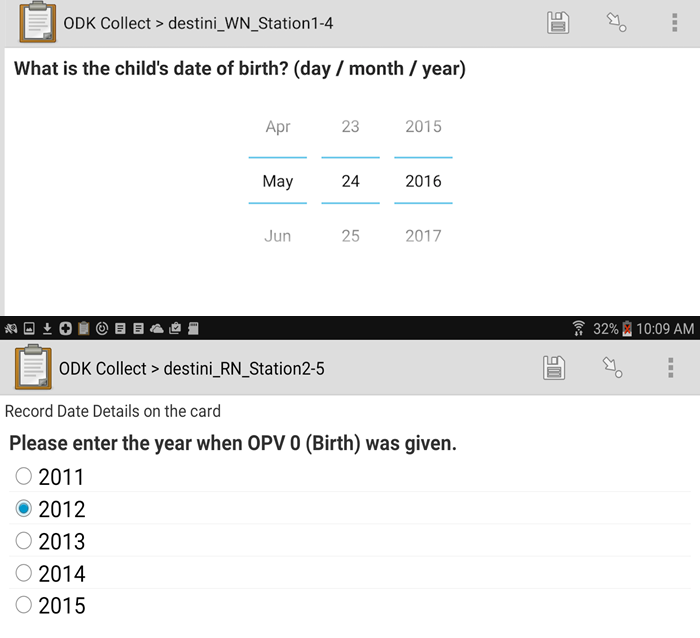
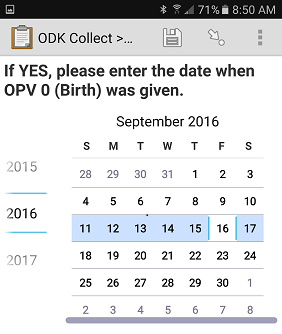
eHA hired 24 data collectors who each entered approximately 600 mock vaccination dates from a packet of vaccination cards provided (Figure 1). The data collectors moved through 12 stations and inputted the mock vaccination dates, covering every possible combination of three experimental factors: device (smartphone or tablet); Open Data Kit (ODK) interface (radio button, calendar, or pinwheel); and confirmation protocol (‘double entry with required agreement’ or ‘single entry’).
Error rates varied considerably by participant. Future research is needed to recommend an optimal data entry solution to yield low data entry error rates for dates, but radio buttons are promising. The radio button data entry interface on a smartphone using double entry yielded the lowest mean estimated error rate (2.7%) out of the 12 possible combinations. In contrast, the calendar data entry interface on a smartphone using single entry (no confirmation) yielded the highest mean error rate (9.9%).
“Estimated Error Rates for 12 Experimental Combinations” depicts 95% confidence intervals for two devices (phone and tablet) with three ODK interfaces (radio, wheel, calendar) and data entry protocol (‘no confirmation’ also known as single entry; and ‘double entry’ also known as ‘double entry with required agreement’). Mean error rates per data entry protocol are listed at right for each device and interface combination. The figure indicates the average error rate (5.1%) with a vertical line. Each two-dimensional distribution is a stack of confidence intervals, from 0.01% confidence at the peak to 95% confidence at the base. The distributions are scaled to have equal area, so the narrow ones are tall and the wide ones are short.
eHA obtained ethical approval from the Kano State Ministry of Health before conducting this experiment. eHA and Biostat Global Consulting presented these research findings at the International Conference on Questionnaire Design, Development, Evaluation, and Testing (QDET2) in November of 2016.
Error Rates for 12 Experimental Combinations
